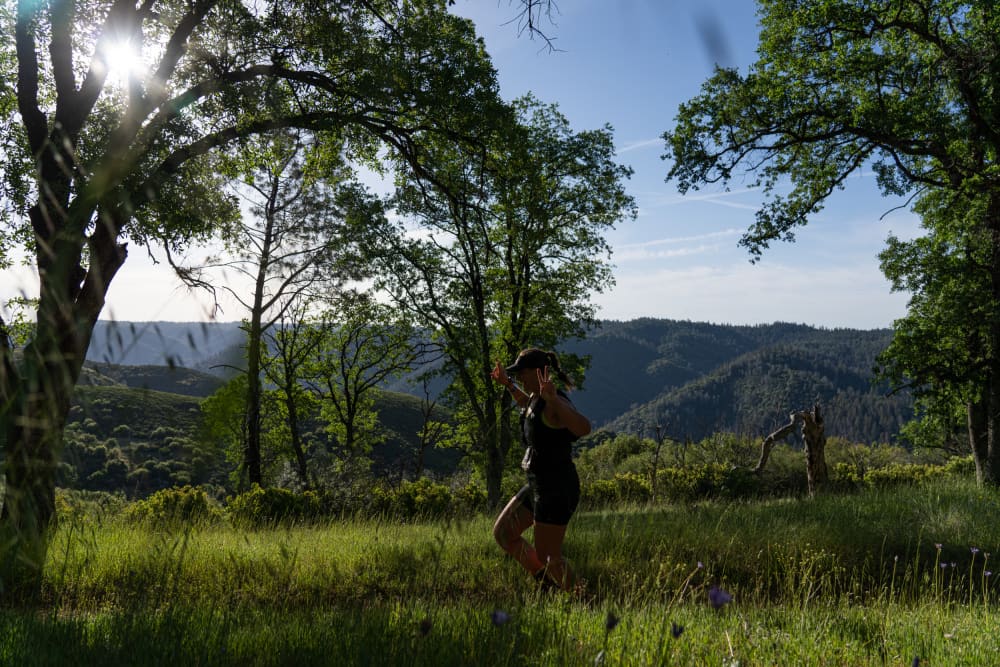
The Canyons Endurance Runs - 25K, segment by segment

Your rank over 5 segments, vs runners at your level — 323 starters measured on the 2026 edition.

The Canyons Endurance Runs - 25K, 25 km — the course whose 5 segments this page analyzes

Where did you stand?

Your bib or name is enough. Free, no account, no payment.

Free, no account. Your bib only helps us find your times, nothing else.

How to read this page

“Ahead of 62% of runners”
On this segment, 62 runners out of 100 at your level took longer than you. Statisticians call this the 62nd percentile; same thing. 100 = fastest, 0 = slowest.
“Your level”
The 60 runners whose UTMB Index is closest to yours, in the same edition. Not the winner, not the field average: people who run like you do. The index ranges from around 300 to 1,000.
“The median”
The time that splits the field in half: half did better, half did worse. On Cool - 2, it's 29 min. Sturdier than an average, which a single very slow runner is enough to shift.
“The central half”
The shaded zone on the graph: between the fastest quarter and the slowest quarter. Half your group sits there. Staying in it from start to finish means you held your rank.
“The trend”
The solid line. Your rank bounces around segment to segment—a bathroom stop moves it. The trend smooths these jitters to show the real drift. The gray dots are your actual ranks, unretouched.
“A segment”
The section between two timing checkpoints. This race has 5, wildly different lengths—that's why the graph spaces them evenly instead of by kilometer.

Where runners drop out on The Canyons Endurance Runs - 25K

12 of 323 starters didn't reach the finish, that's 3.7%. The median drop-out point is at km 10.46.

DNF count per checkpoint
CheckpointkmDNFs
Cool - 110.469
No Hands - 219.372
No Hands - 15.631

Real times, segment by segment

Durations measured on starters from the 2026 edition, indices 223 to 920, median 419. The central half of the field runs from 25th to 75th percentile.

Duration of each segment: median and central half of the field
SegmentkmMedianCentral halfMeasured
Start - Auburn → No Hands - 15.6344 min40 min – 49 min222
No Hands - 1 → Cool - 14.8353 min48 min – 1 h 01221
Cool - 1 → Cool - 23.4429 min23 min – 34 min309
Cool - 2 → No Hands - 25.4740 min33 min – 47 min309
No Hands - 2 → Finish - Auburn5.6952 min44 min – 1 h 01311

Questions about The Canyons Endurance Runs - 25K

How many runners DNF on The Canyons Endurance Runs - 25K?

12 of 323 starters didn’t reach the finish in the 2026 edition, i.e. 3.7%. Split times were recorded bib by bib from the official timing, which only publishes finishers. RAVIT survey of September 21, 2026.

Where do runners DNF on The Canyons Endurance Runs - 25K?

Km 10.46: Cool - 1 accounts for 9 of 12 DNFs in the 2026 edition. Then No Hands - 2 (2) and No Hands - 1 (1); together, 12 DNFs. The last recorded checkpoint is definitive. Log from September 21, 2026.

What's the longest segment on The Canyons Endurance Runs - 25K?

53 min median: time from No Hands - 1 to Cool - 1, over 4.83 km, measured on 221 runners in the 2026 edition. The middle half of the field ran between 48 min and 1 h 01. Log from September 21, 2026.

What's my time compared to on this page?

To 60 runners closest to your index, in a max 25-point index window, on the edition you pick. On each segment, the reference is runners who reached that checkpoint. DNFs count as long as they were racing.

Does this page compare my race to a prediction?

No, not here. This page compares your rank to that of real runners, segment by segment, with no predictions. Your gap to your own plan is shown in your plan debrief: on the Pacing screen, once your race is done.

Data from this page

Measurements for each edition are downloadable in CSV: one line per segment, with median, quartiles, number of runners measured and DNFs per checkpoint. Comma separator, point decimal, UTF-8 encoding. Reuse conditions for this data

Other races analyzed

Prepare for The Canyons Endurance Runs - 25K: profile, aid stations and cut-off timesEvery race analyzed segment by segmentView all trail races in calendar

Where these numbers come from. Split times are logged checkpoint by checkpoint from the official race timing, then recalculated by segment. DNFs are reconstructed bib by bib; official results only publish finishers. Analysis by RAVIT — ravit.live, data from September 21, 2026.